

Sask. farmer finds profitability mapping allows him to maximize production and efficiency
By Kate Ayers
Profitability mapping has changed Saskatchewan farmer Terry Aberhart’s approach to crop production and how he manages the land. Together with his ag consultants, Aberhart analyzes his field data and gross revenue from across his fields.
Profitability maps can be generated using yield data and the cost of production for each field. These maps colour code zones of the field to indicate areas that are making money, losing money or, perhaps, simply breaking even.
Farmers can use ag software to collect information from their fields over several years. Then, they can use profitability mapping to track areas which produce consistent economic gains or losses. Farmers can then make management decisions accordingly.
Aberhart has used profit maps for 10 years and has changed a number of agronomic practices as a result. In fact, his average yield has increased slightly since using the technology.
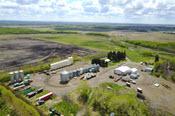
Last year, he worked 11,000 acres and is looking to expand to 14,000 acres this year. He grows hard red spring wheat, malt barley, canola, peas, hemp and some corn.
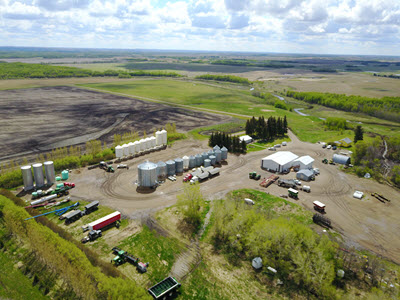
Terry Aberhart photo
“We got involved with profitability mapping through the consulting work that we do with Sure Growth Technologies Inc., our agronomy consulting company, and Agri-Trend,” says Aberhart.
“We haven’t necessarily done analytics on every field but we’ve analyzed some of the fields a little more deeply because of maybe some bigger issues present.”
Aberhart works closely with Agri-Trend to build and refine his use of precision ag technology. This partnership helped Aberhart choose the best precision ag software for the farm.
“We just started working with that platform and, … from a farm management and especially agronomic perspective, the Trimble Ag Business Software (formally called Agri-Data) does a strong job of recording all the fertilizer inputs, the analysis of soils and tissue testing, and it breaks down costs,” explains Aberhart.
The profitability maps also present the cost per bushel for each management zone in the field. This information allows Aberhart to gain a better grasp of the variations in his farm’s production, so that he can manage the land accordingly.
“We started to look at some specific examples where we averaged five years’ worth of (yield data) and net returns. Some of these areas averaged negative margins across five years. Why would we do all that work to lose money? That was a pretty huge revelation for us,” says Aberhart.
When Aberhart identified the areas of the field that were costing him money, it was an easy decision to take those “trouble” areas out of row crop production and plant forages instead. Generally, these zones were in low-lying and wet areas of the field which were usually problematic throughout the growing season.
“Not only are we removing the hardest part of the field to farm, we are also removing those negative margins. We are doing less work and making more money. And that’s exciting,” says Aberhart.
Profitability mapping has also enhanced his farm’s sustainability and productivity.
“I think it’s an approach that is actually much more sustainable and has fewer environmental impacts because we are not applying fertilizer and chemicals to those areas with very low or very little production,” says Aberhart.
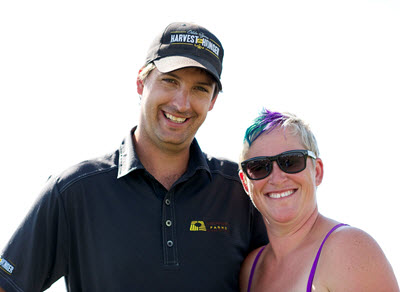
Terry and Lichelle Aberhart
“By putting (less productive land) in hay, we’re reducing operational stress and the work it takes to manage your crop. We are also improving those areas over time.” BF
Post new comment