


by JOHN BANCROFT
New Features in Crop Market Fact$ starting this week:
- The Canadian dollar noon hour value is added to the table showing the market prices – it is the noon hour value each Tuesday
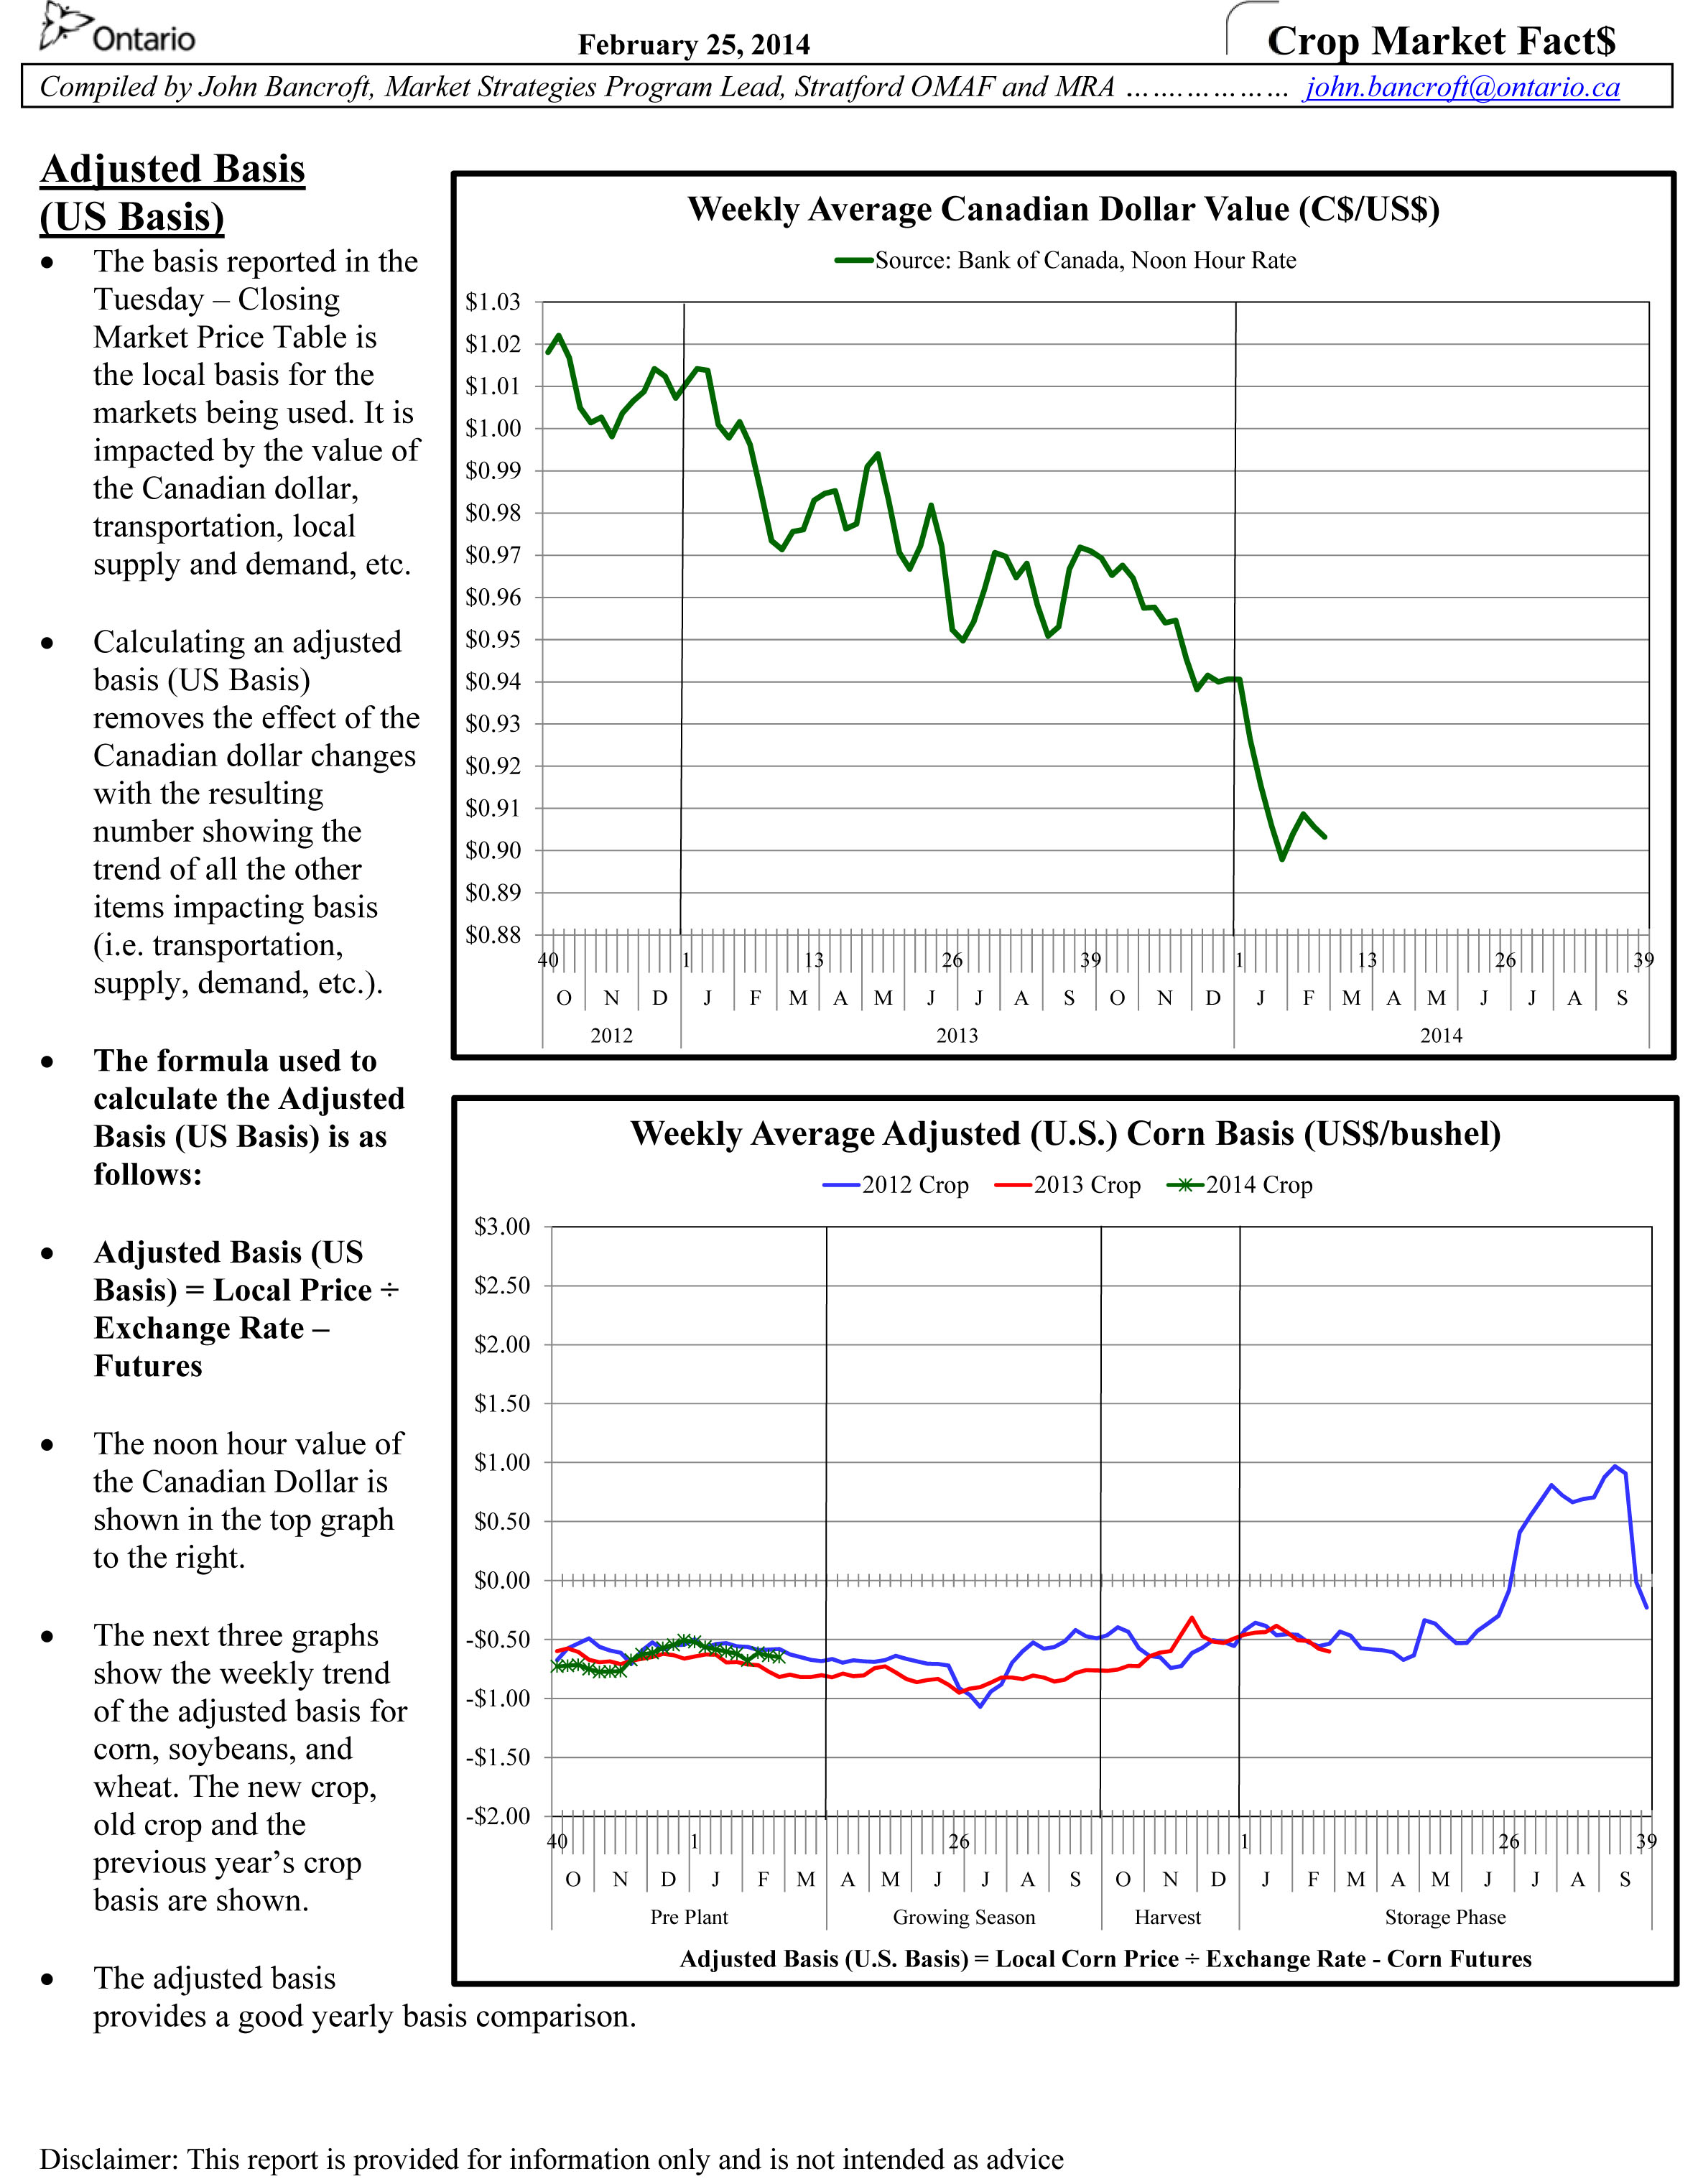
- A graph showing the trend of the weekly average Canadian dollar value is added on page 3
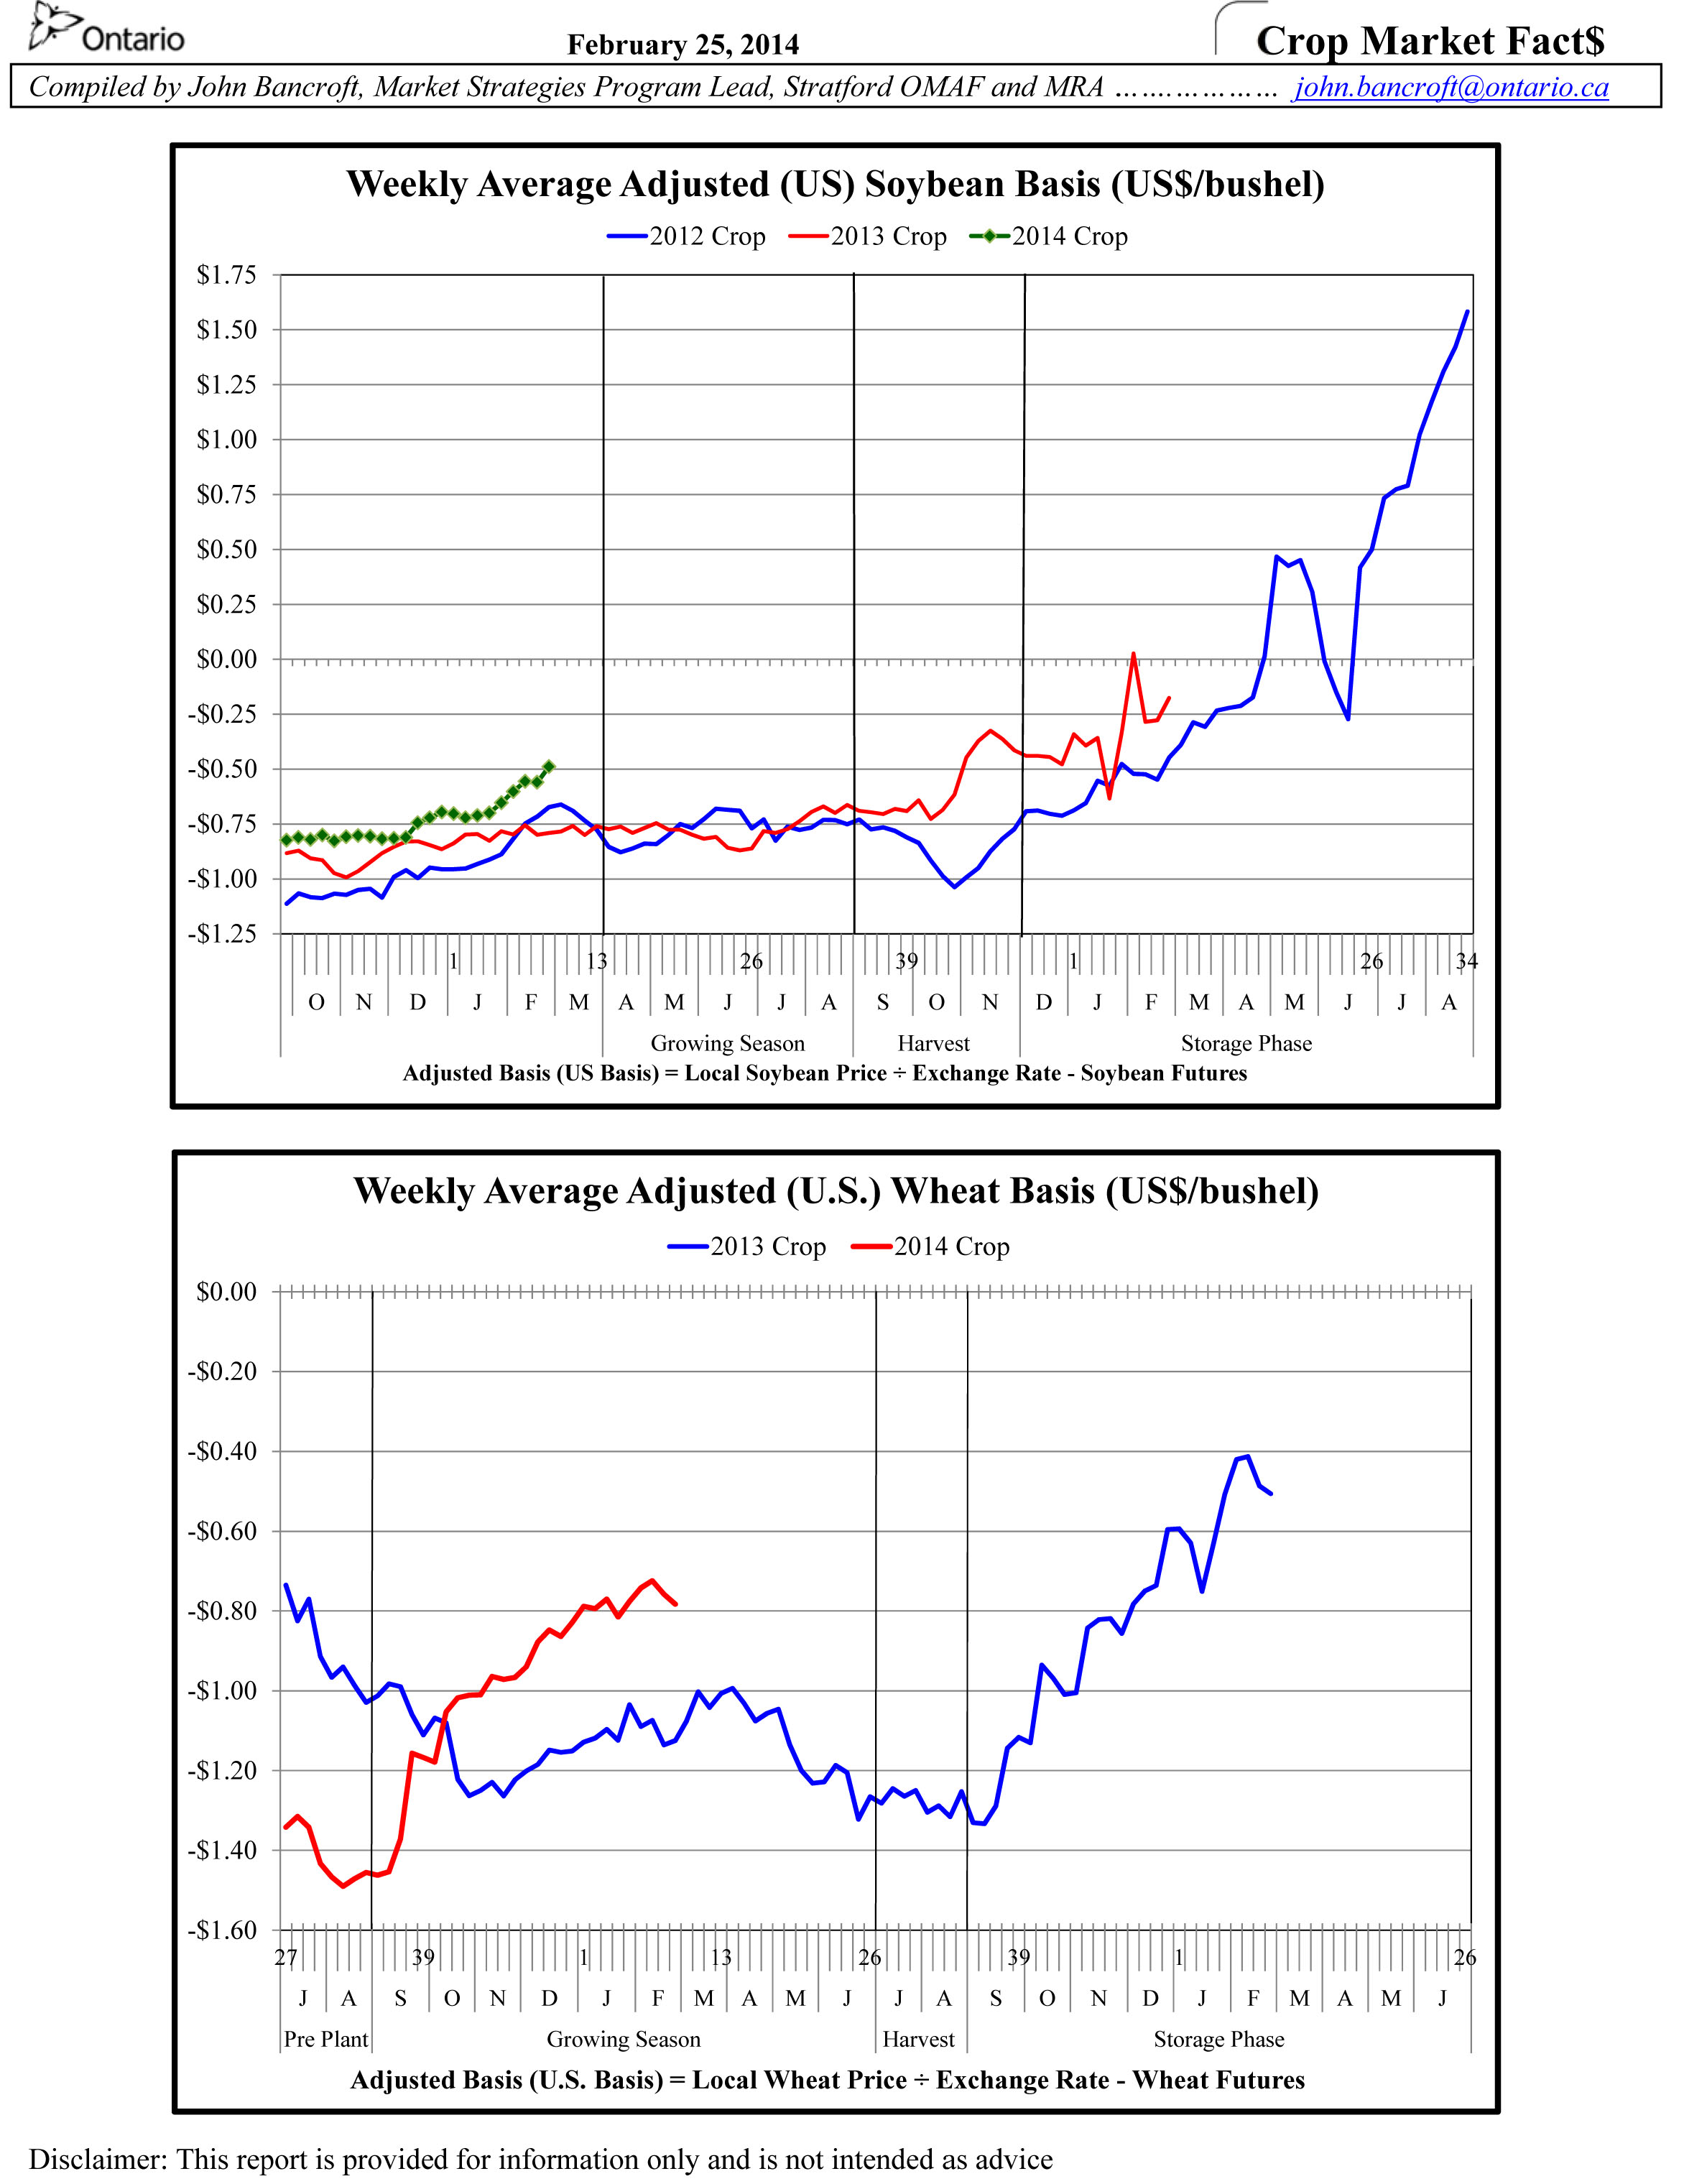
- Three graphs have been added to show the trend of the adjusted basis for corn, soybeans and wheat on pages 3 and 4. An explanation is provided on page 3.
Features of Crop Market Fact$
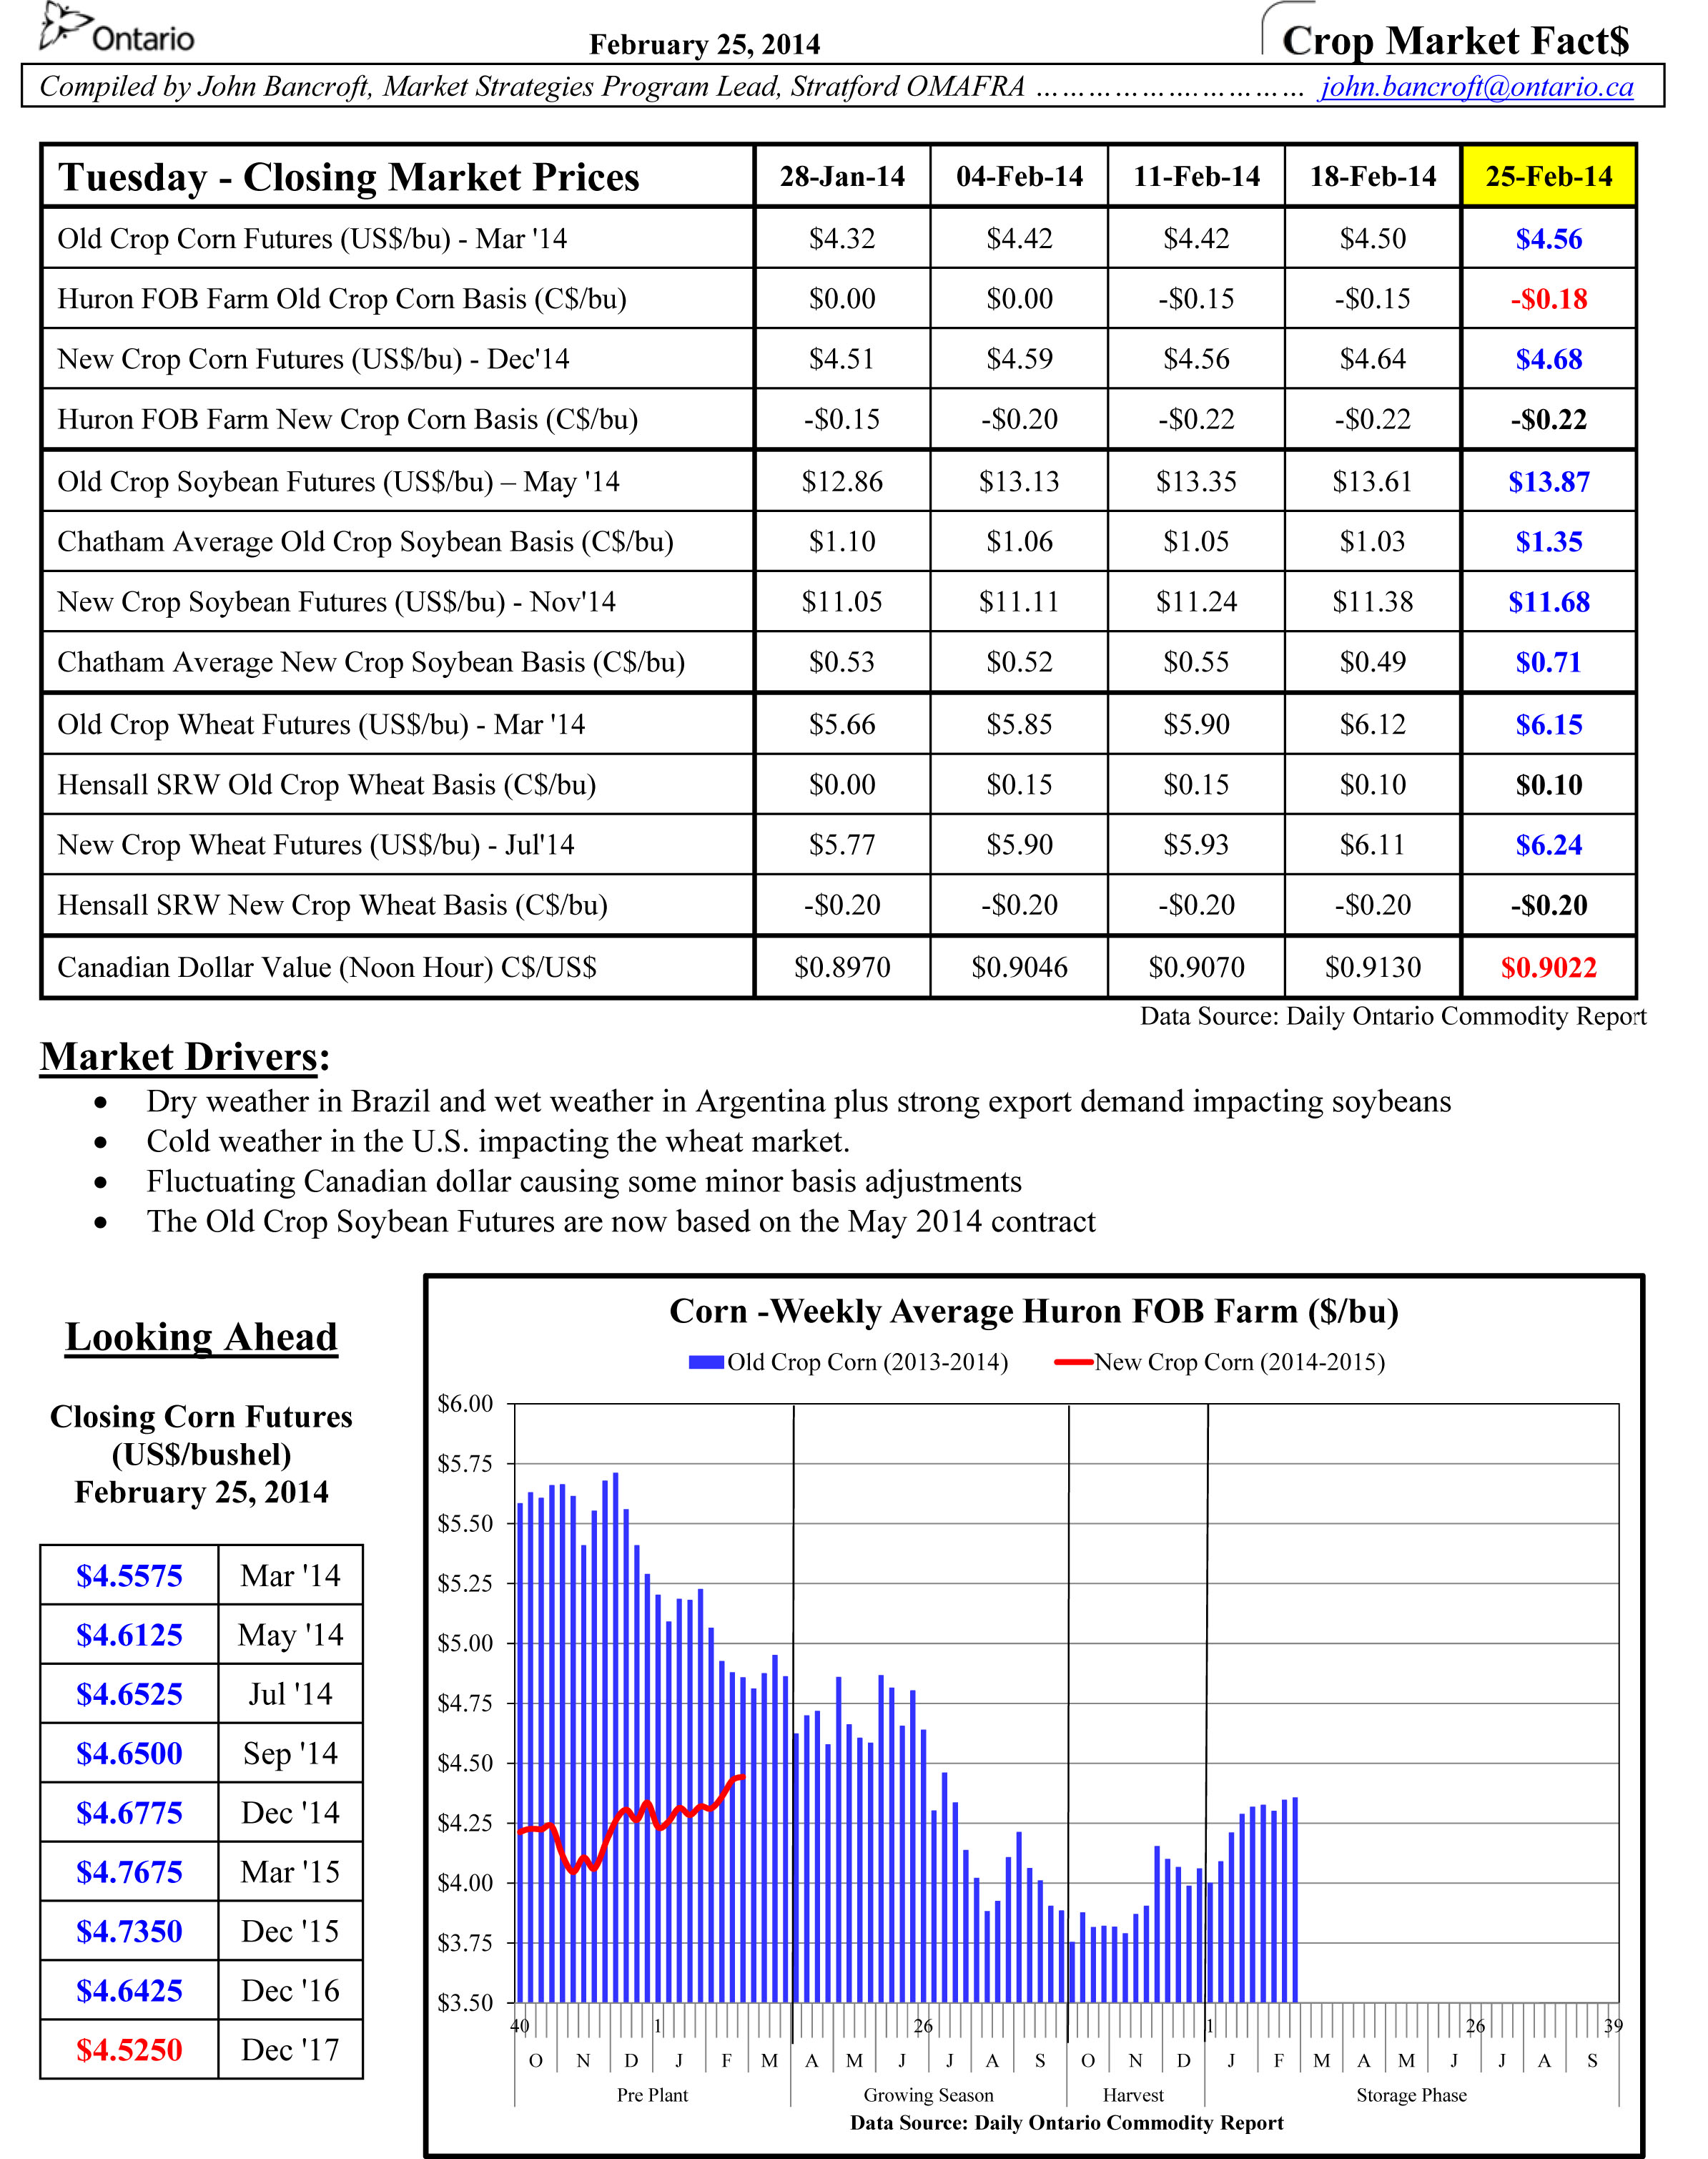
- A table showing the market prices for the current Tuesday and the preceding four Tuesday’s based on the closing market information on Tuesdays. Old crop and new crop prices broken out into futures and basis will be shown for corn, soybeans, and soft red wheat. This will show the short term trend for each item over the last five weeks.
- For the current week (i.e. February 25, 2014 in the right hand column in the attached report) the reported numbers will be shown in blue if they are up from the previous Tuesday, red if they are down from the previous Tuesday, and black if they remain the same as the previous Tuesday. With a quick glance at the table, you will be able see if an item is up or down from the previous week.
- The next section in the report will be the “Market Drivers”. This will feature a few quick items to indicate the current drivers impacting the market.
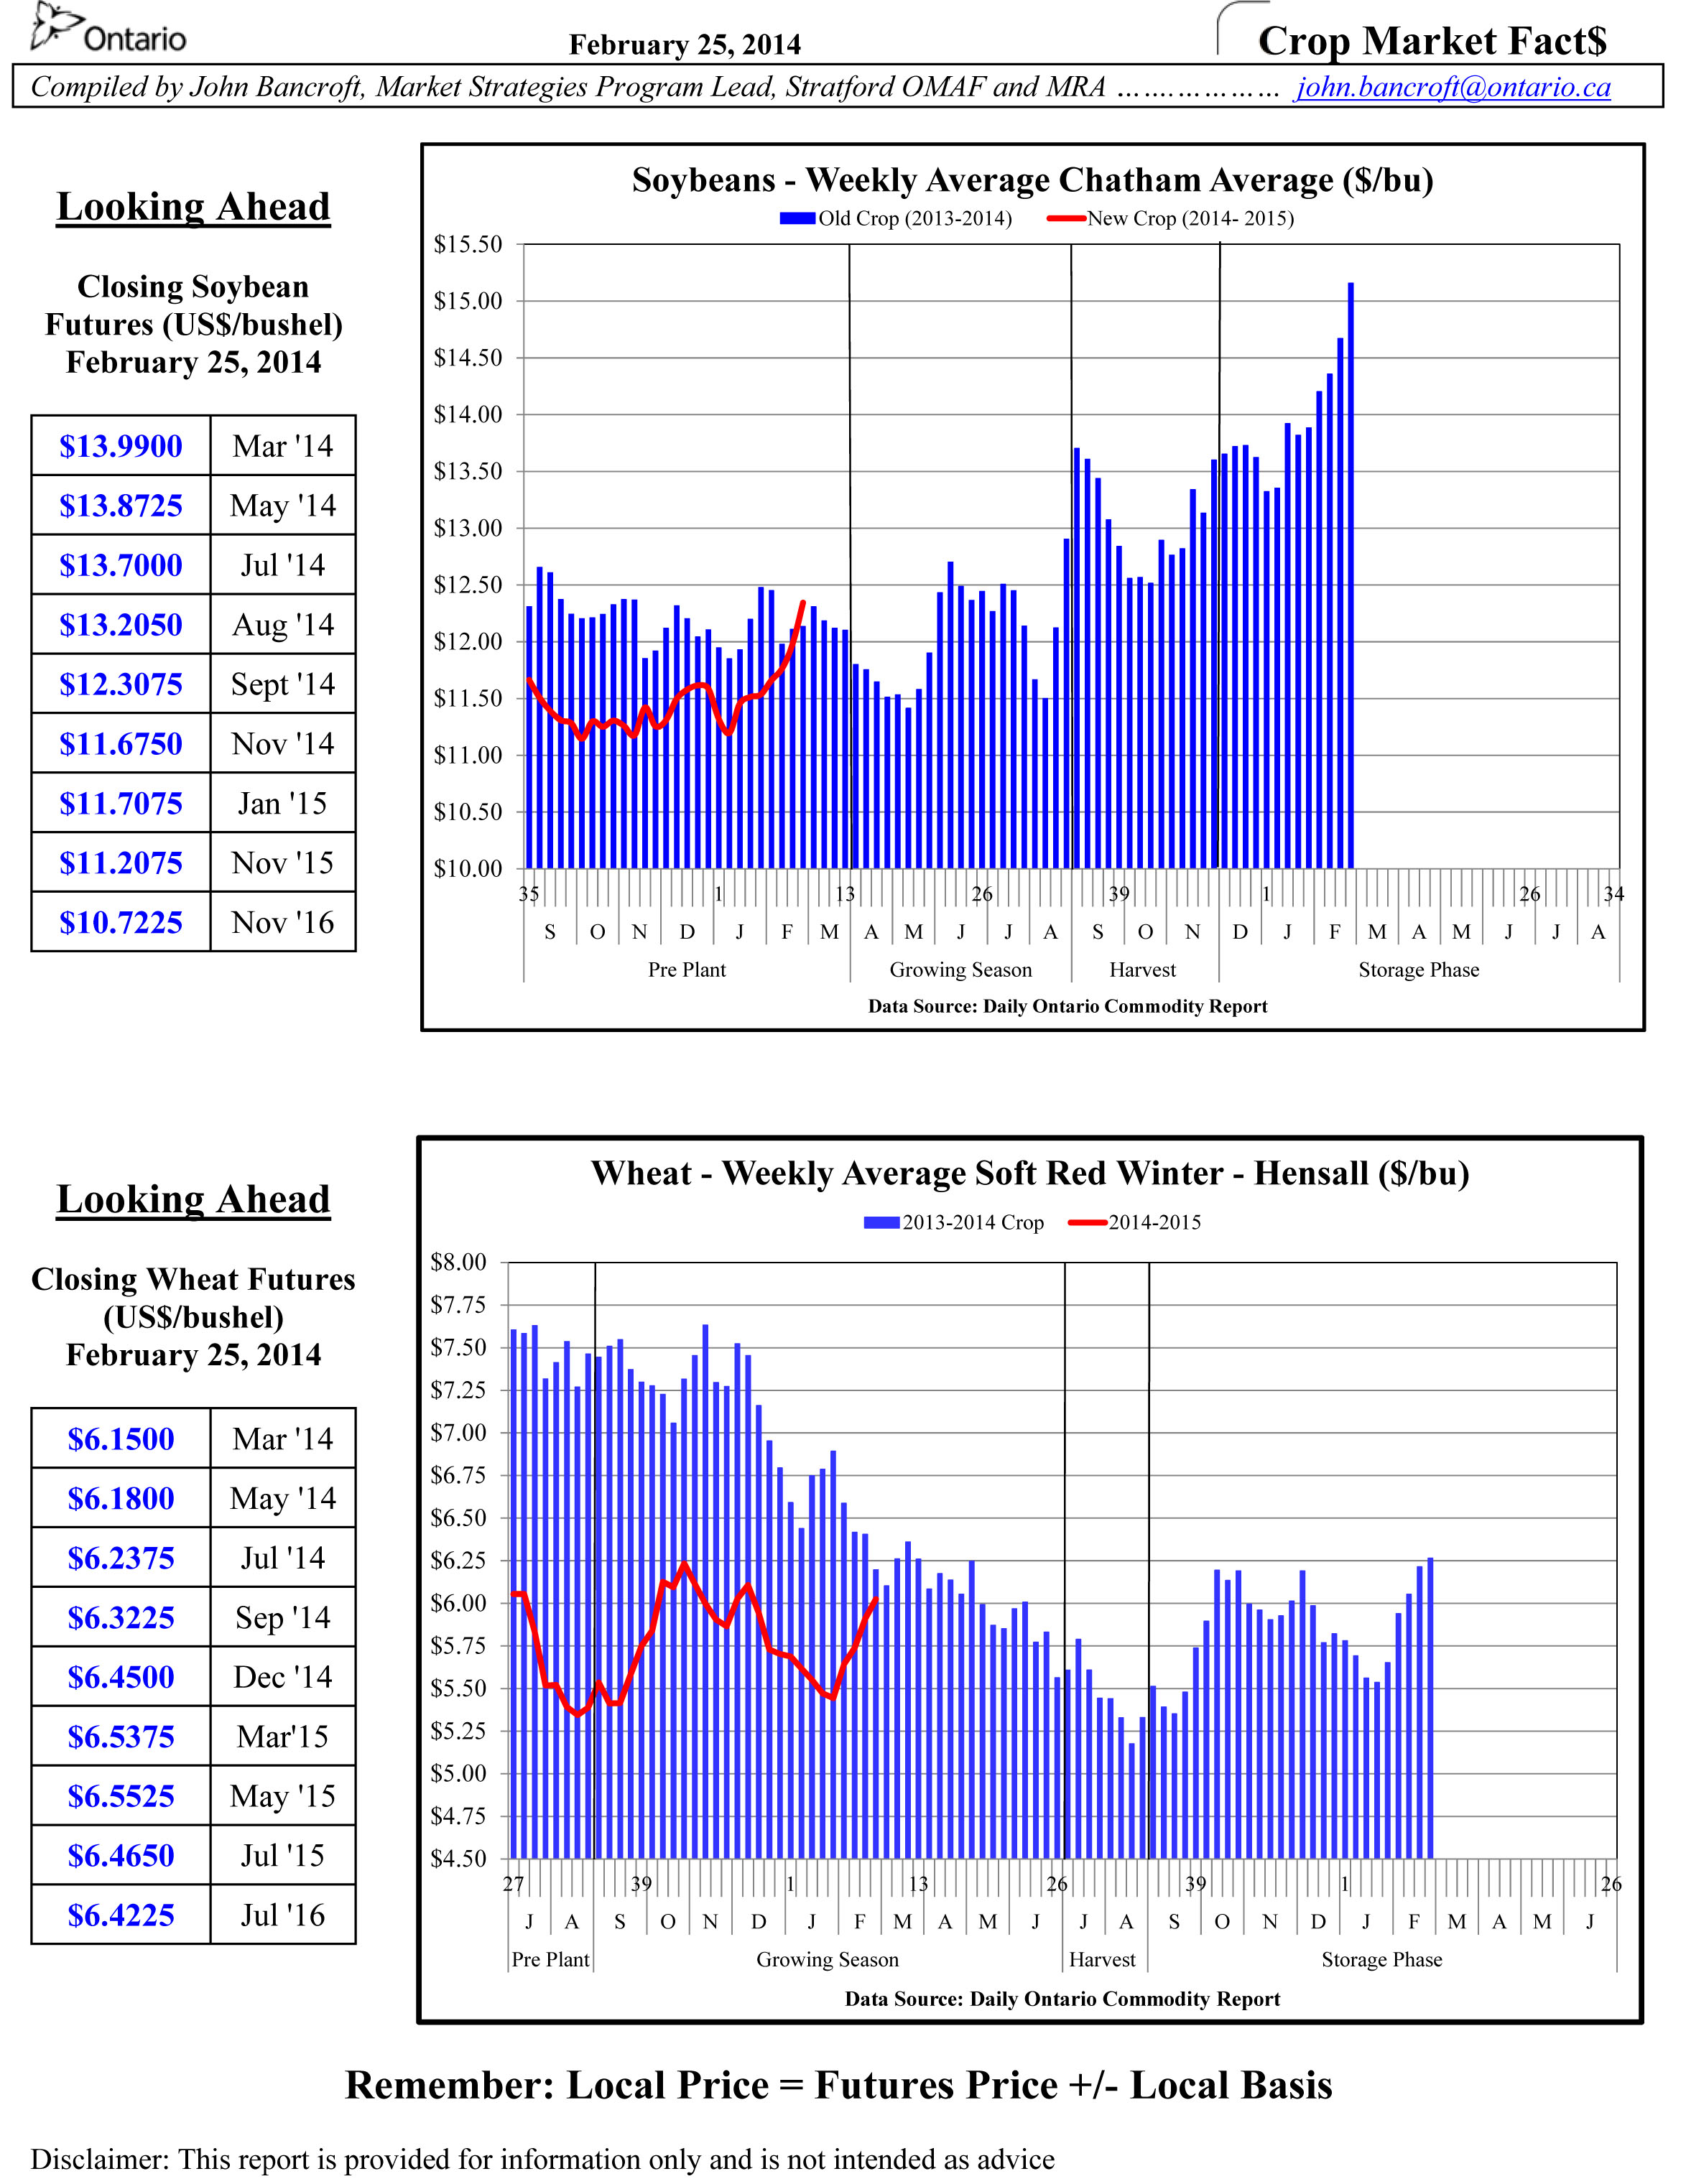
- For each of the crops corn, soybeans and wheat a weekly price trend graph and snapshot showing the Closing future prices for the current Tuesday will be shown. The graph will show the old crop price (blue bars) and the new crop price (red line) as they proceed through the pre-plant, growing season, harvest and storage phases. The Closing Future Prices will be shown in blue if they are up from the previous Tuesday, red if they are down from the previous Tuesday, and black if they remain the same as the previous Tuesday.
Posted on:
February 25, 2014