


by JOHN BANCROFT
Welcome to Crop Market Fact$ in 2014. As reminder the features of the attached report are outlined below.
This coming Friday, January 10, 2014, the USDA will be releasing the World Agricultural Supply and Demand Estimates
Features of Crop Market Fact$
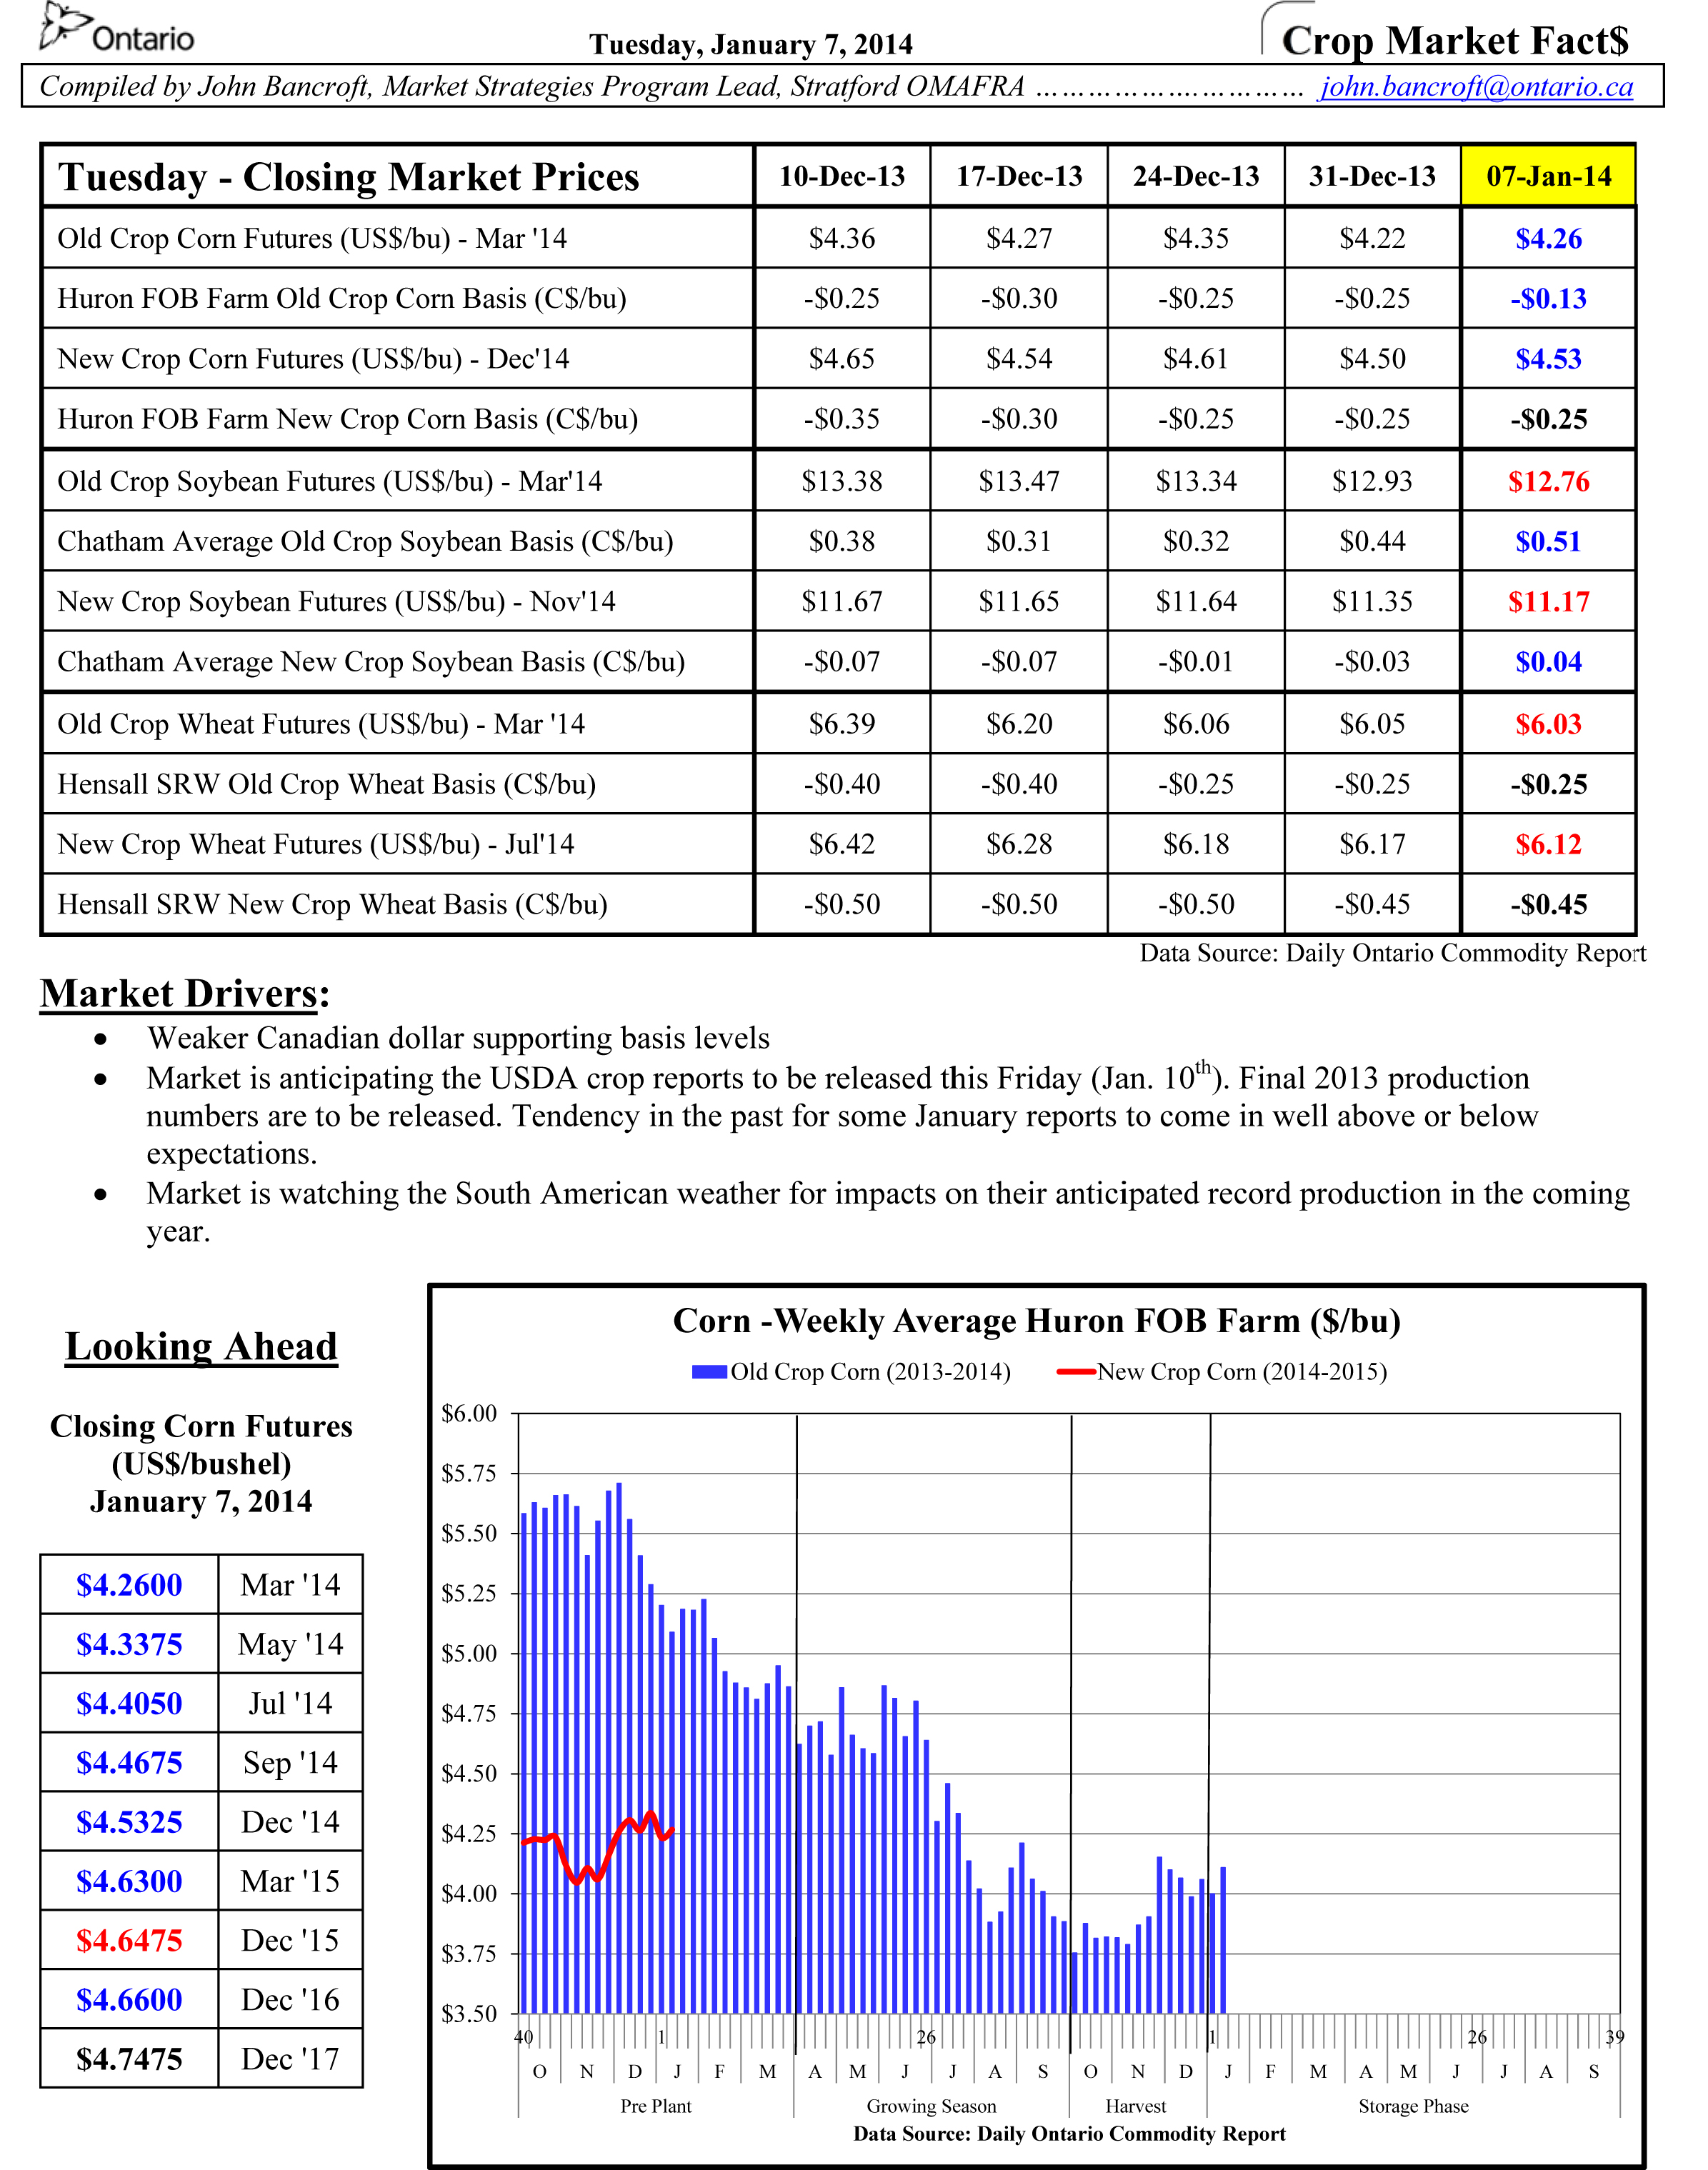
- A table showing the market prices for the current Tuesday and the preceding four Tuesday’s based on the closing market information on Tuesdays. Old crop and new crop prices broken out into futures and basis will be shown for corn, soybeans, and soft red wheat. This will show the short term trend for each item over the last five weeks.
- For the current week (i.e. January 7, 2014 in the right hand column in the attached report) the reported numbers will be shown in blue if they are up from the previous Tuesday, red if they are down from the previous Tuesday, and black if they remain the same as the previous Tuesday. With a quick glance at the table, you will be able see if an item is up or down from the previous week.
- The next section in the report will be the “Market Drivers”. This will feature a few quick items to indicate the current drivers impacting the market.
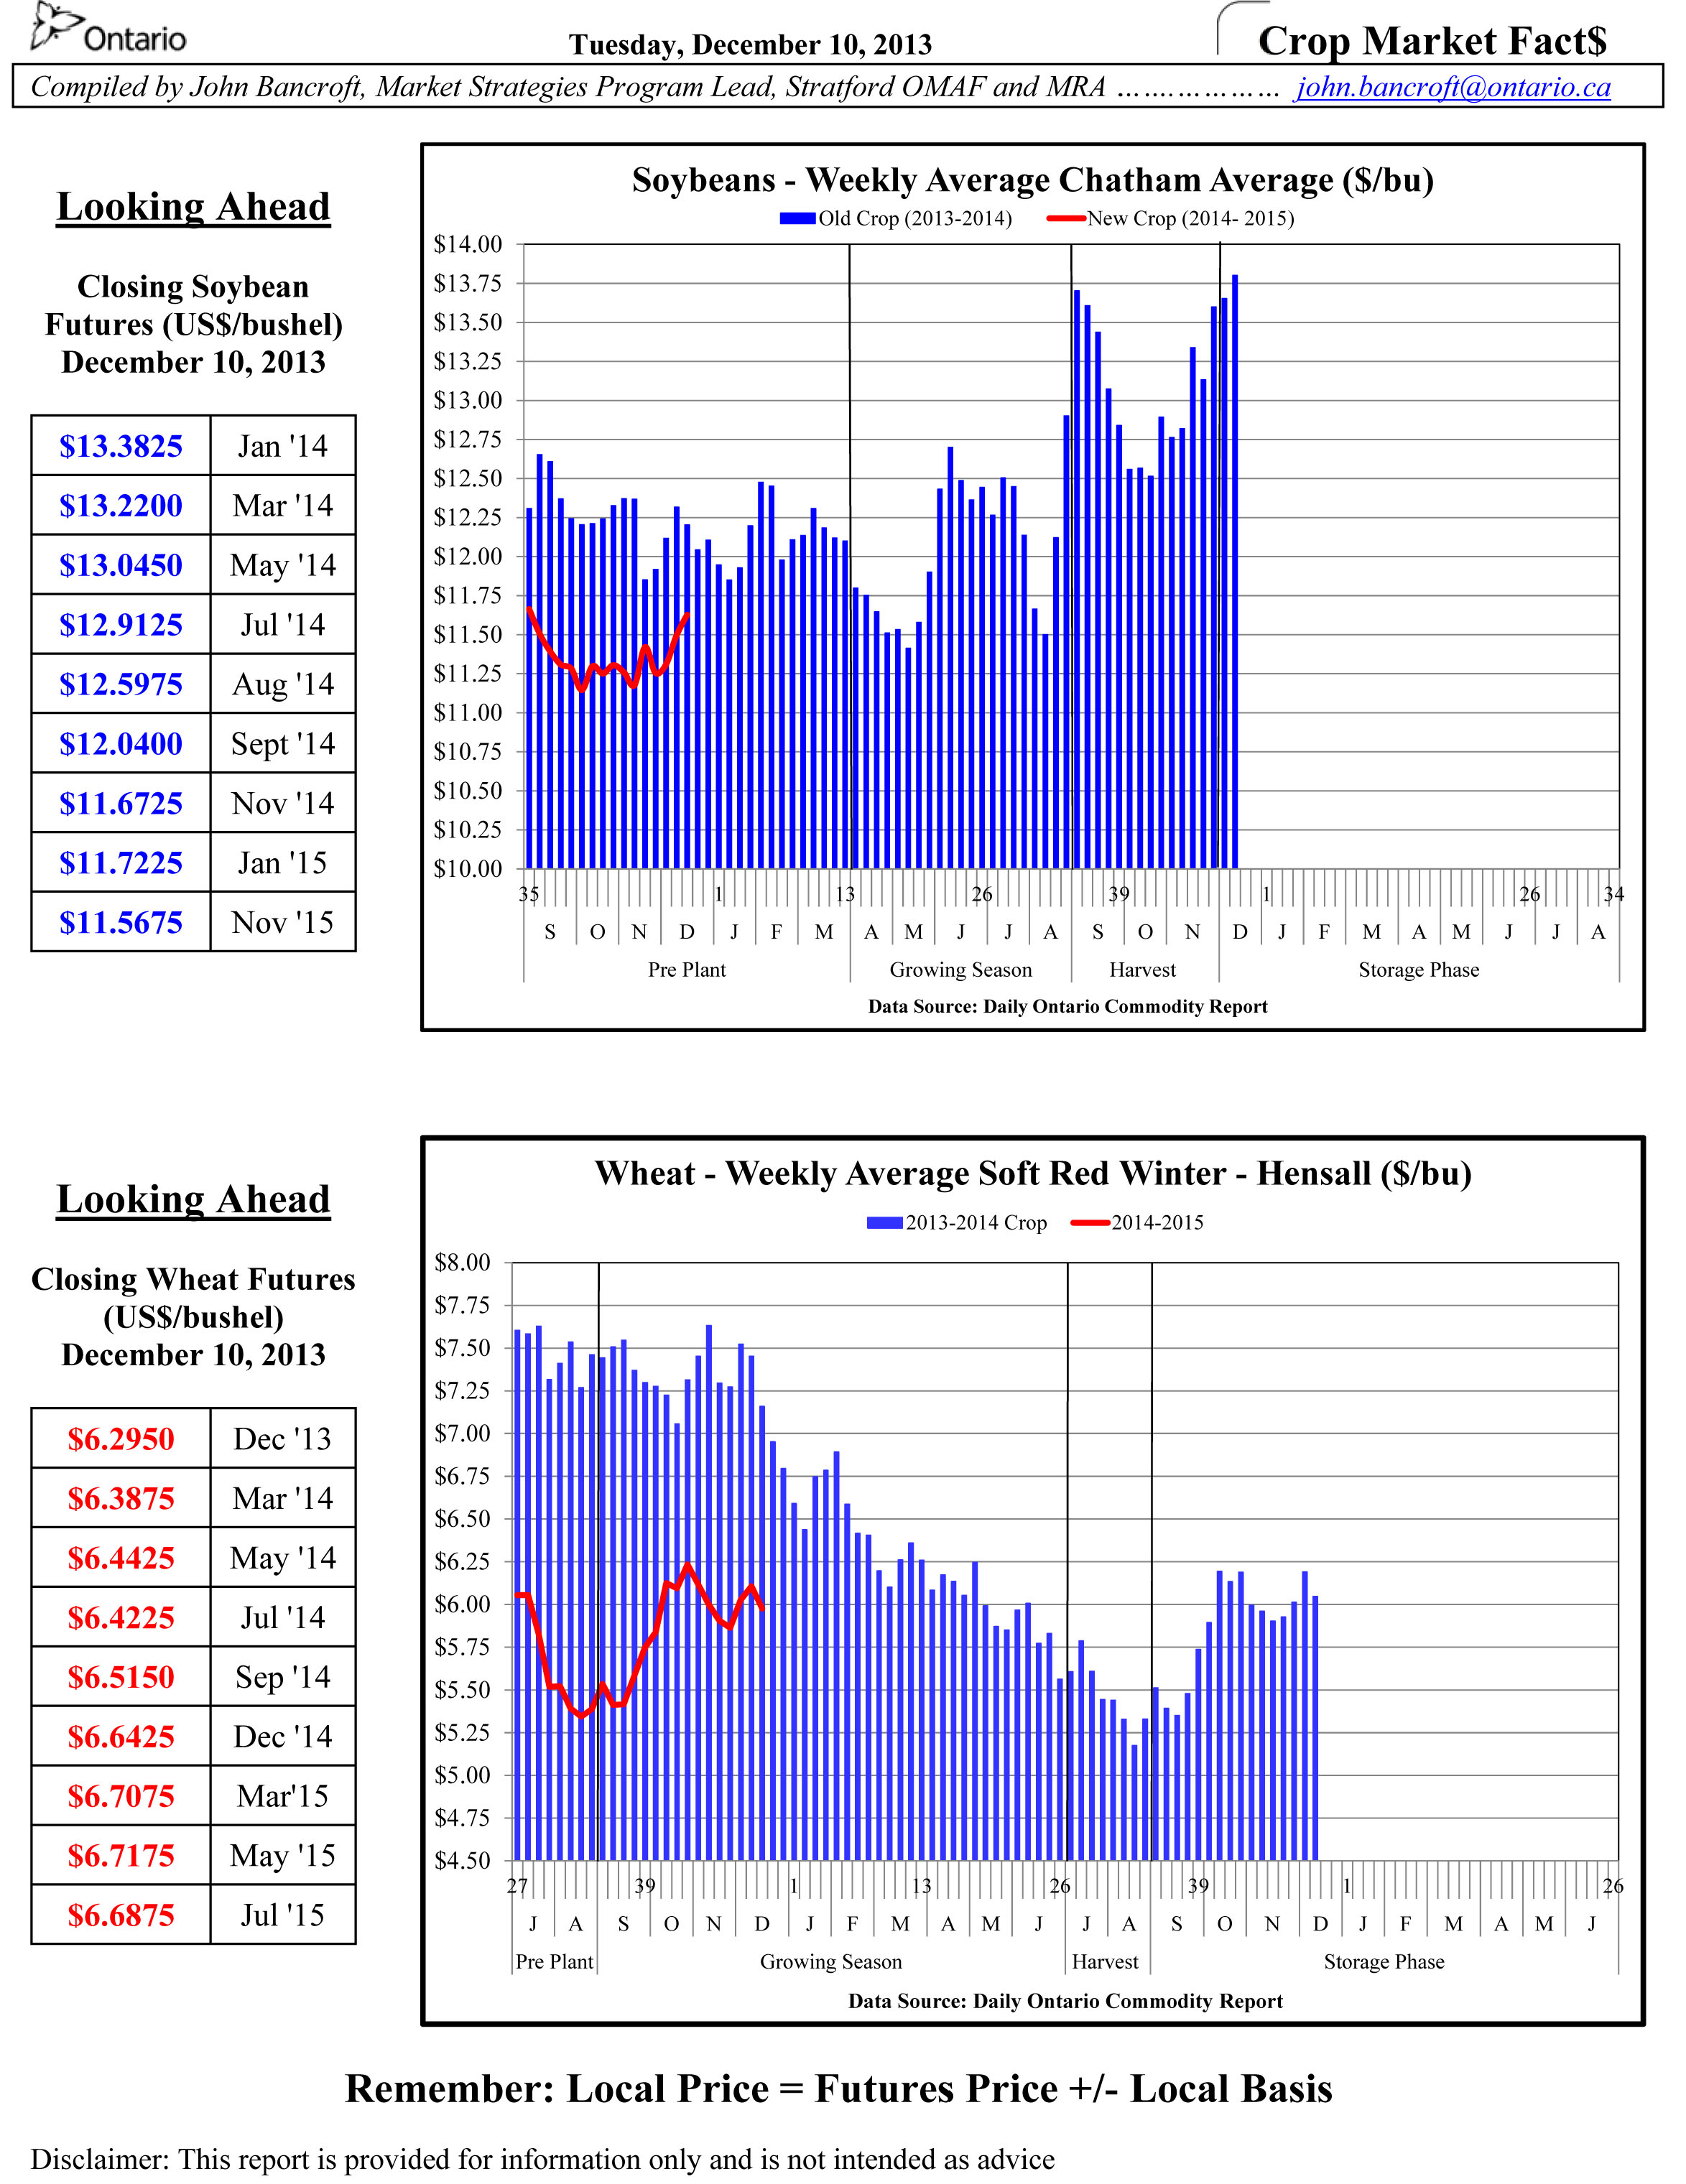
- For each of the crops corn, soybeans and wheat a weekly price trend graph and snapshot showing the Closing future prices for the current Tuesday will be shown. The graph will show the old crop price (blue bars) and the new crop price (red line) as they proceed through the pre-plant, growing season, harvest and storage phases. The Closing Future Prices will be shown in blue if they are up from the previous Tuesday, red if they are down from the previous Tuesday, and black if they remain the same as the previous Tuesday.
Posted on:
January 7, 2014