


by JOHN BANCROFT
Market Drivers:
- Reuters reported that through their poll of crop market analysts it indicated that the U.S. corn harvest was about 20% completed (up 8% from last week) and the soybean harvest about 22% completed (up 11% from previous week) as of October 6.
- Harvest pressure, variable weather, some export demand, and stronger ethanol production numbers are impacting the daily market price movements
- The South American market planting conditions are being watched now
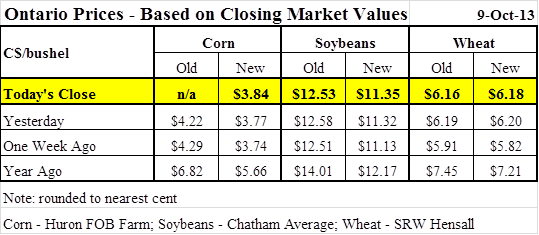
- Both old and new crop corn is currently based off the December futures contract. New crop basis has been holding at -$0.65 to -$0.70 per bushel in Western Ontario.
- Old crop corn basis varies widely depending on location, some users have come back into the market with the delay in this year’s harvest to-date and some are not making offers anymore.
- The old crop soybean prices now reflect the 2013-2014 crop that is being harvested and the new crop soybean prices now reflect the 2014-2015 crop that will be planted next spring.
- No weekly U.S. Crop Progress reports and October World Agricultural Supply and Demand Estimates reports are being released due to the shutdown of the US Government.
Highlights from the Statistics Canada Production of Principal Field crops, September 2013 <http://www.statcan.gc.ca/daily-quotidien/131004/dq131004a-eng.htm> (released last Friday)
- The Canadian total wheat production is expected to rise 22.0% from 2012 to a record high 33.0 million tonnes. The increase is based on an expected record average yield of 48.0 bushels per acre (up from 42.6 bushels per acre in 2012) and an expected increased area of harvest (up 8.1% to 25.3 million acres).
- Ontario soybean production is estimated to decrease 13.2% to 3.0 million tonnes based on a 10.4% yield decline to 43.3 bushels per acre.
- Ontario grain corn production is estimated to decrease 1.6% to 8.6 million tonnes based on a decline in the harvested acreage to 2.2 million acres.
This Week’s Featured Graph:
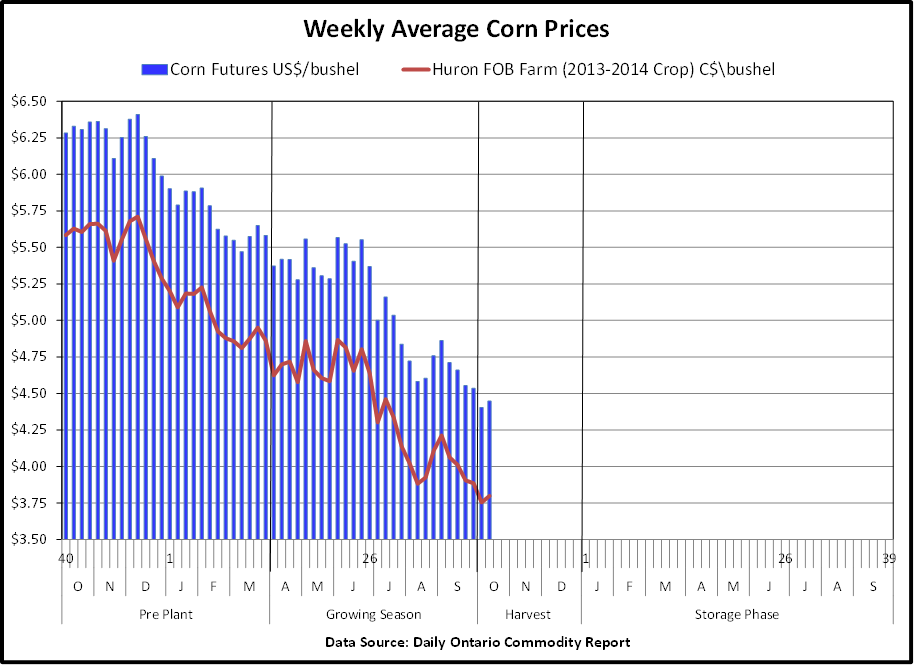
The above graph is based on weekly corn prices:
- Shows the weekly average of the daily closing Chicago corn futures (blue bars) – December 2013 contract
- Shows the weekly average Huron FOB farm corn price (red line)
- The difference between the red line and the top of the blue bar is the average weekly basis (averaged about -$0.70/bushel, currently at -$0.60/bushel)
- Graph still shows a downward trend searching for a harvest low
- Graph starts with October 2012 (week 40) on the left hand side and currently is in October 2013 (week 41)
Disclaimer: This commentary is provided for information only and is not intended as advice
Posted on:
October 9, 2013