Don't bet the farm on the Almanac's weather forecasts
Friday, May 1, 2015
A publication that has survived almost 200 years must be doing some things right, but detailed weather information is not one of them
by PHIL CHADWICK
I enjoy the Farmers' Almanac. Don't get me wrong. If you like the source of your weather information, you are more likely to believe it and overlook the flaws. I was even asked to write the weather section for the Canadian version of this venerable publication. Something that has survived since 1818 must be doing something right. Detailed weather information is not one of those things.
The Farmers' Almanac started in New Jersey two years following the "year without a summer." The year 1816 was a disaster for farmers in northeastern America. Global temperatures dropped by almost one degree Celsius due to a combination of a historic low in solar activity and the largest known volcanic eruption in over 1,300 years. Indonesia's Mount Tambora erupted on April 10, 1815, and ejected biblical amounts of volcanic ash into the upper atmosphere.
A "volcanic winter" followed and lasted through the following summer. In early June 1816, 30 centimetres of snow fell in Quebec City and presumably across central Ontario as well.
So it is not surprising that weather prediction has always been a major feature of the Farmers' Almanac. Predictions are made as far as two years in advance using a "top secret mathematical and astronomical formula that relies on sunspot activity, tidal action, planetary position and many other factors."
The Almanac's forecaster, "Caleb Weatherbee," is secretive for sure. The Almanac Publishing Company claims an 80 to 85 percent accuracy rate for the annual forecasts, but independent studies have shown that their accuracy is equal to chance – a flip of a coin. The 85 per cent percent accuracy evaluation must be the assessment from someone who really likes the source.
A prediction of any type, including a coin toss, must have several characteristics. All of these defining characteristics must be understood by the service provider as well as the client in order to really evaluate the forecasts.
Firstly, the event must be clearly defined. Weather events come in all shapes and sizes and complexity. A winter snow squall is very different from a summer thunderstorm and is much easier to predict. A super cell thunderstorm is very different from a pulse-type thunderstorm and is also much easier to predict. All of these events are forms of potentially severe convection, but they are vastly different. The meteorology, size, duration and predictability of each of these forms of convection are very dissimilar. Only similar meteorological events can be grouped and verified.
Next, the forecast areas must be well defined and of uniform spatial extent. A Farmers' Almanac forecast for region 3, "southern Ontario," stretches as far north as James Bay. Areas east of Toronto are actually in their "southern Quebec" forecast region. A forecast for this large an area cannot be compared to a forecast for the area the size of a typical Ontario county.
The ease of predicting a weather event in a large area is comparable to hitting the broad side of a barn door with a dart. The challenge of forecasting that same event within a particular county is more like hitting the bull's eye of a dart board hanging on that same barn door. The challenge of getting the forecast correct for the county is much harder than hitting the barn door with the dart. The accuracy must decrease as the challenge goes up.
Similarly, the forecast time periods must also be clearly defined and of uniform temporal extent. The Almanac's two-month forecast for a region is not the same problem as the six-hour afternoon forecast. The challenge of placing an event within a very small temporal bin is much more challenging than predicting "cold waves toward the end of the month." The skill of predicting a specific temperature at an unambiguous time is bound to be less common than a hand-waving prediction of turning colder sometime in the future. The challenges of placing events in a large time interval are much less demanding than locating them to a specific minute.
Lead time is the final challenge for the meteorologist to provide advance notice of the event. The difficulties increase with the lead time required to predict the event before it occurs. The Almanac attempts a lead time of two years or more in order to meet the printing deadlines. A meteorologist is happy to get a lead time of a matter of days or even hours for a significant weather event.
The event, forecast area, forecast time period and lead time must all be the same in order to really compare forecast accuracy. The terms being used to describe the event must be compatible with the degree of precision and the anticipated accuracy resulting from the challenges of the forecast. The Farmers' Almanac appropriately uses trends and descriptive words like "hot," "cold" and "wet" instead of specific numbers like "33 C", "-17 C" and "75 millimetres" of rain.
Precision is not the same thing as being accurate. We need both and we need them in both time and space for the same event. The sketch below illustrates these important differences.
A specific client of weather services will have definite requirements for both precision and accuracy in their applications. Weather services around the world have been unable to definitively articulate the accuracy of their services at these different levels of precision. My research from the 1990s invented an approach to performance measurement that had the promise of being all things to all clients. It has yet to catch on, although I had hopes that it would change and revitalize the provision of weather services – and it all stems from the Farmers' Almanac.
My original research has been published on the Northern-Latitude Meteorology website within the Case Study Library (www.meted.ucar.edu/communities/norlatmet/). There are many papers attempting to explain this approach to performance measurement in different ways. The hope was that one of those explanations might connect and become viral. It hasn't happened yet. I can explain it to you with just a few words and pictures. Maybe Better Farming can make this a reality.
For a specific weather event, we can scale the spatial area of the forecast from very small to very large. If high precision is required to place the event in space, the challenges to get the forecast accurate will be almost insurmountable. The meteorological skill in producing an accurate forecast for tiny forecast areas would be very low – the low point on the right side of the yellow graph below.
If low precision is required to place the event in space, the forecast areas are very large. The challenges in getting the forecast right are more like hitting the broad side of a barn door. The meteorological skill in producing an accurate forecast for these very large forecast areas would also be very high – the high, skilful point on the left side of the yellow graph.
At some point between these two extremes, the slope of the graph will be maximized, identifying the spatial scale where meteorologists have dramatically increasing skill. Clients can have some confidence in forecasts produced for regions of this spatial scale or larger. Forecasts for smaller spatial regions would not be as skilful, even though that measure of precision might be desirable for the client.
The time period of the forecast can also be scaled in the same way as the size of the forecast area. If high precision is required to place the event in time, the challenges to get the forecast accurate within a very short time interval will also be insurmountable. The meteorological skill in producing an accurate forecast for specific tiny forecast time periods would be very low – the low point on the left side of the graph at right.
Similarly, if low precision is required to place the event in time, the forecast time interval would be very long. The challenges in getting the forecast right would be small, such as in predicting that it will get colder in December. The meteorological skill in producing an accurate forecast for very long forecast time periods would be very high – the high, skilful point on the right side of the white graph.
Space and time must be combined. Precision in space is not useful unless you also have precision in time. A forecast of a severe thunderstorm over a specific county is not useful unless you can also say when it will happen.
Performance measurement in both space and time is actually three-dimensional. I caution you that this is where people's eyes glaze over. Nesting the above graphs together so that meteorological skill increases with both the size of the forecast area and the time interval of the prediction results in the following.
The lowest skill is observed when the forecast must be very precise in both time and space – the zero point on the performance measurement surface at the lower corner. A forecast with this extreme degree of precision in time and space might be extremely desirable, but it cannot be very skilfully produced because of the extreme challenges in analyzing and diagnosing the atmosphere at that very fine scale.
The highest skill is observed when the forecast is imprecise both in space and time. The upper corner is the highest skill for the forecast of a particular event. Such a forecast might not be particularly useful, but it is skillful.
The requirements for any potential client can be found somewhere on this performance measurement surface. The meteorological skill of providing their service at their time and space scale is simply the level of the graph.
A series of these constructs is required with stepped lead times. These have been automatically generated using interactive software that I wrote to build the prototype system.
The three dimensional performance measurement space can be all things to all clients. The slope of the surface reveals where meteorological skill increases. The volume under the surface is a one number, conservative quantity that can be tracked to measure trends in skill due to advances in the science of meteorology. There are too many potential applications to describe here! This is not science fiction, but meteorological reality with applications wherever unbiased evaluations of performance are required.
The Farmers' Almanac weather predictions occupy the upper zone of the model. The forecasts are for large areas and long time periods and the challenges required to predict something that sounds plausible are not too high, plus it is entertaining reading.
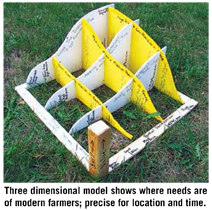
The weather requirements of the modern farmer can be found in the lower zone of the 3-D model, see left. The forecasts must be for reasonably precise areas and time intervals. The meteorological skill is lower in accurately provide these services. With continued research, meteorologists might get there. A forecast that is accurate and precise is gold – worth way more than the $8 dollars per citizen per year that currently funds the Canadian weather service.
Thankfully the modern farmer doesn't really need a lead time of two years. As of right now, the Farmers' Almanac's forecasts for 2016 or even 2017 have probably already been calculated and submitted. Amazing but I wouldn't bet the farm on the accuracy of these forecasts. BF
Phil the Forecaster Chadwick has been a professional meteorologist since 1977, specializing in training, severe weather and remote satellite and radar sensing.